Advanced Reporting - Introduction
SynergyThe Web Report Designer in Synergy Workforce allows users to create, execute, and export custom reports. This guide provides an overview of the user interface and the key functionalities available in the tool.
Accessing the Web Report Designer
Navigate to the Main Menu.
Click on Reports.
Select Web Report Designer.
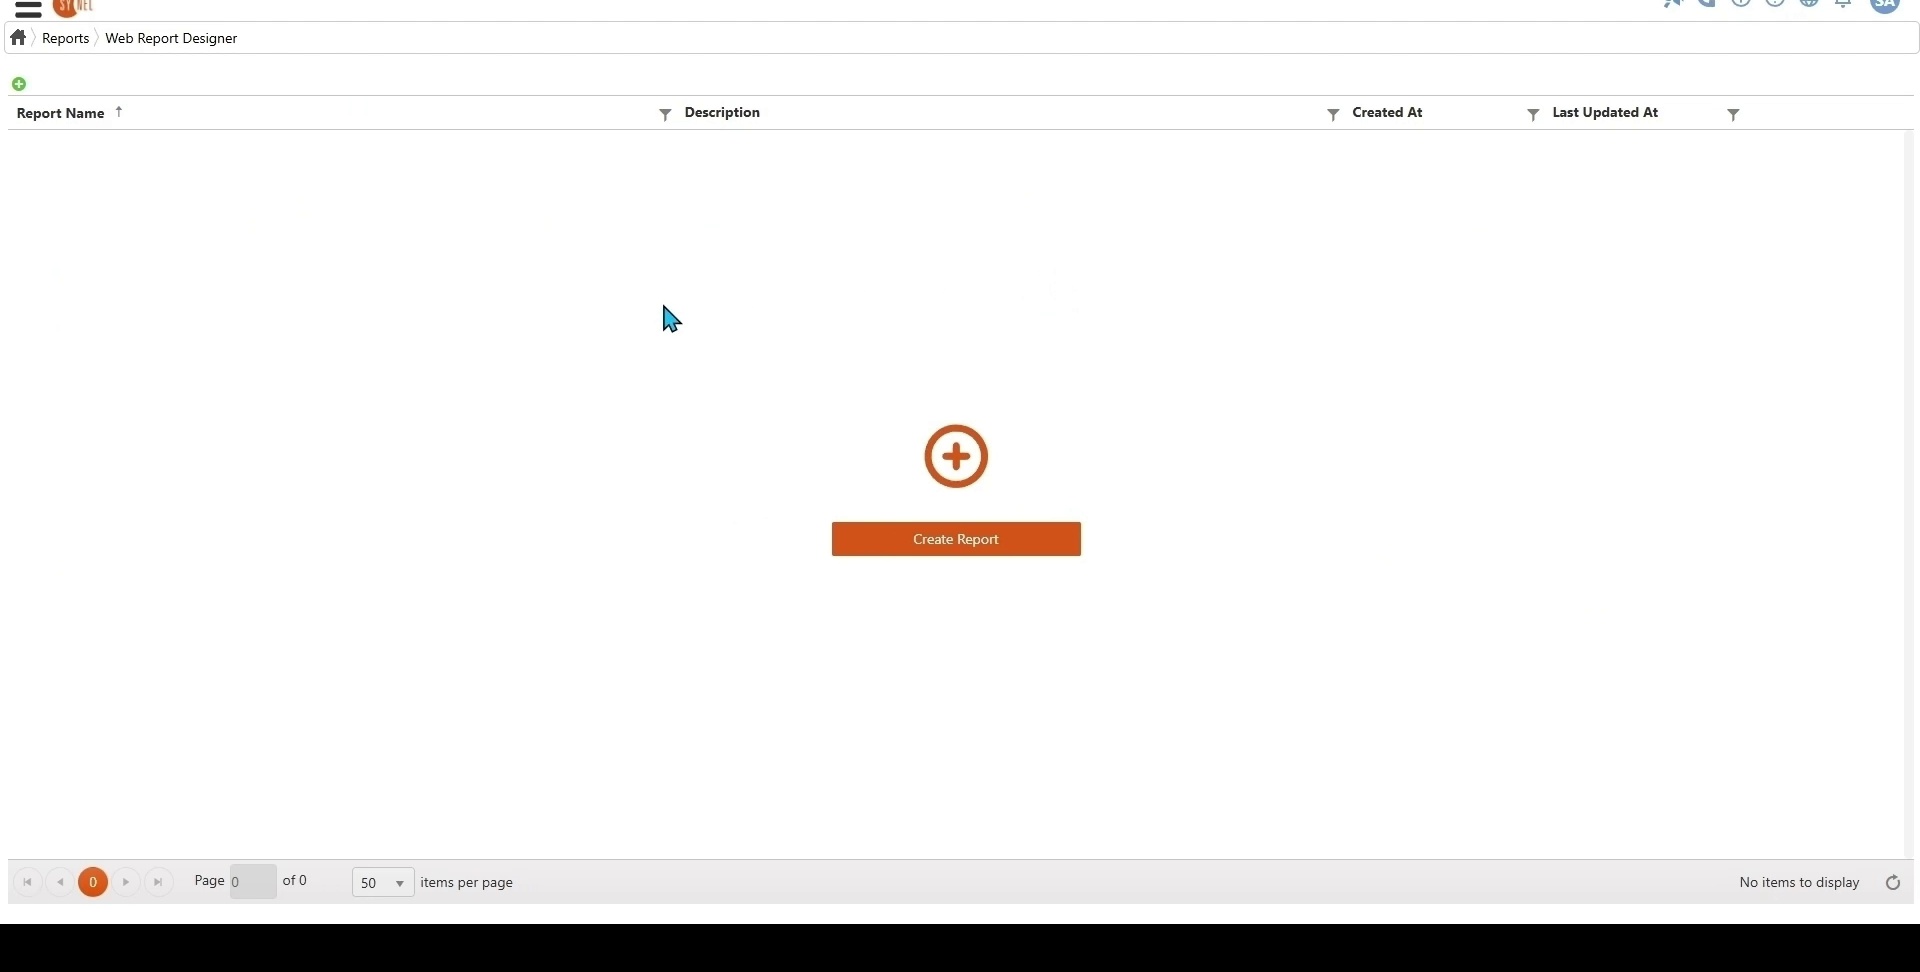
Upon opening, the report list displays all previously created reports. If no reports exist, the list will be empty.
Creating a New Report
Click the Create Report button or the plus (+) icon.
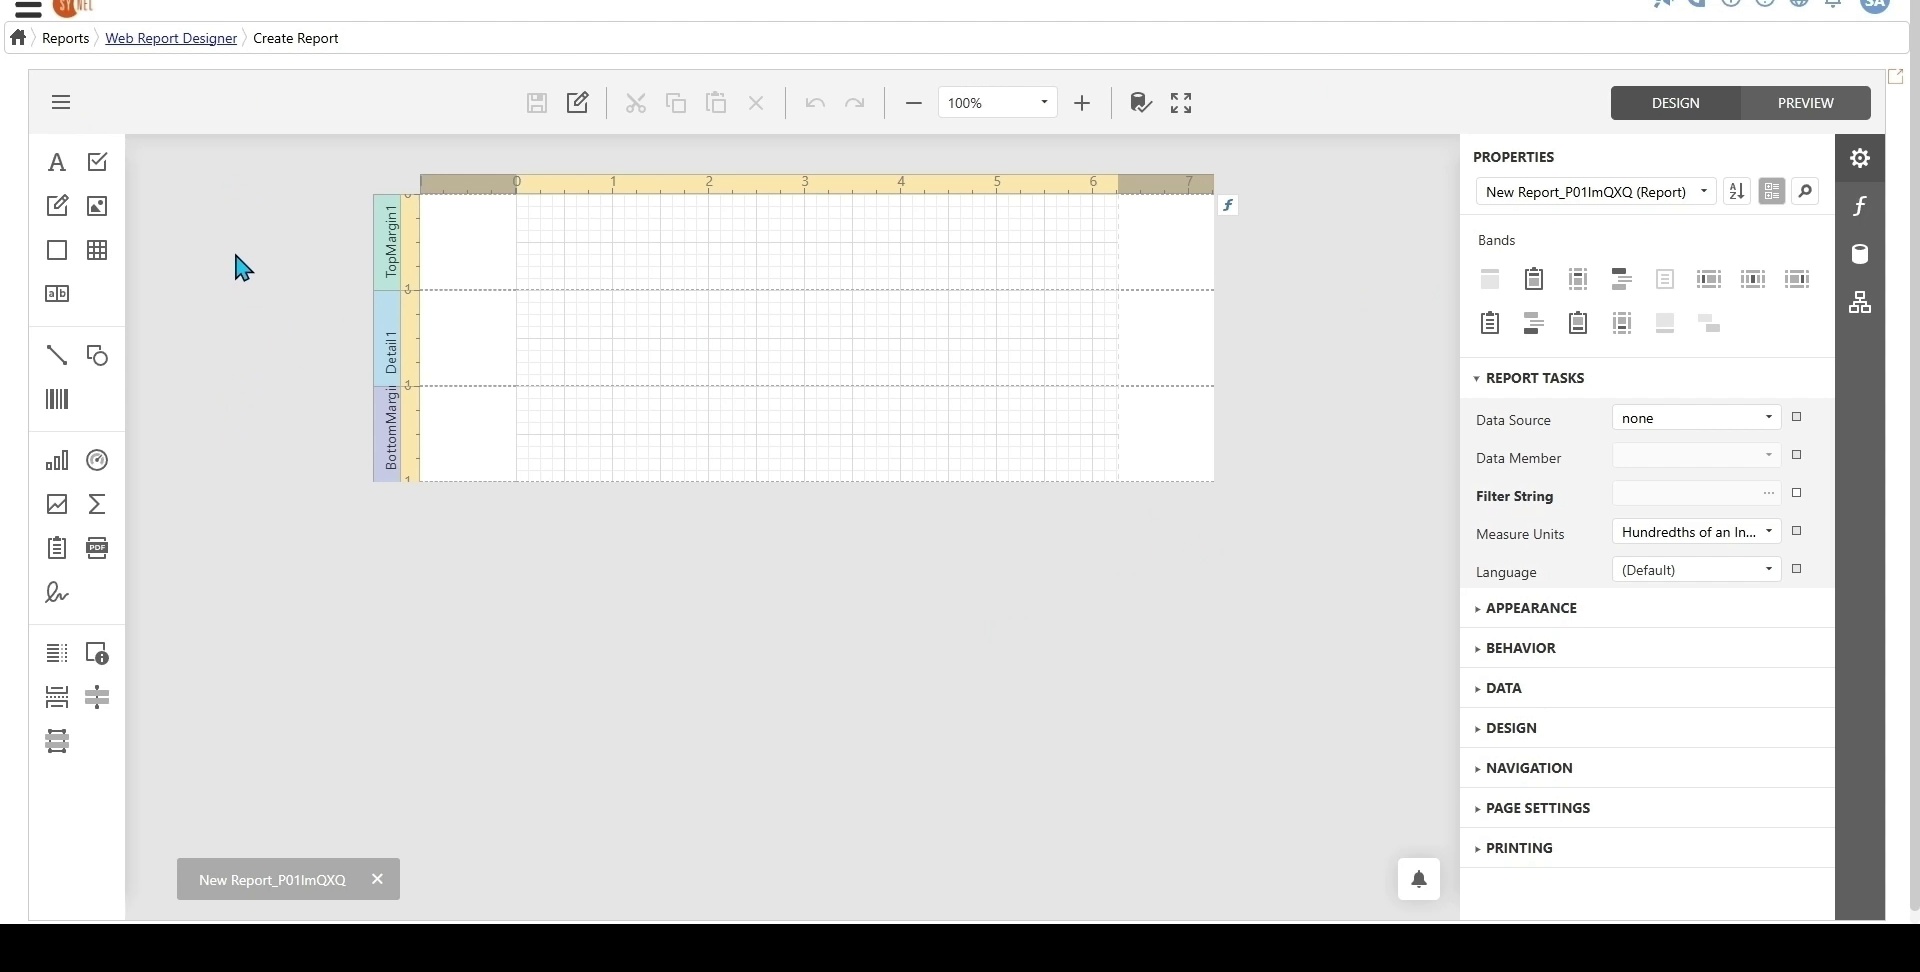
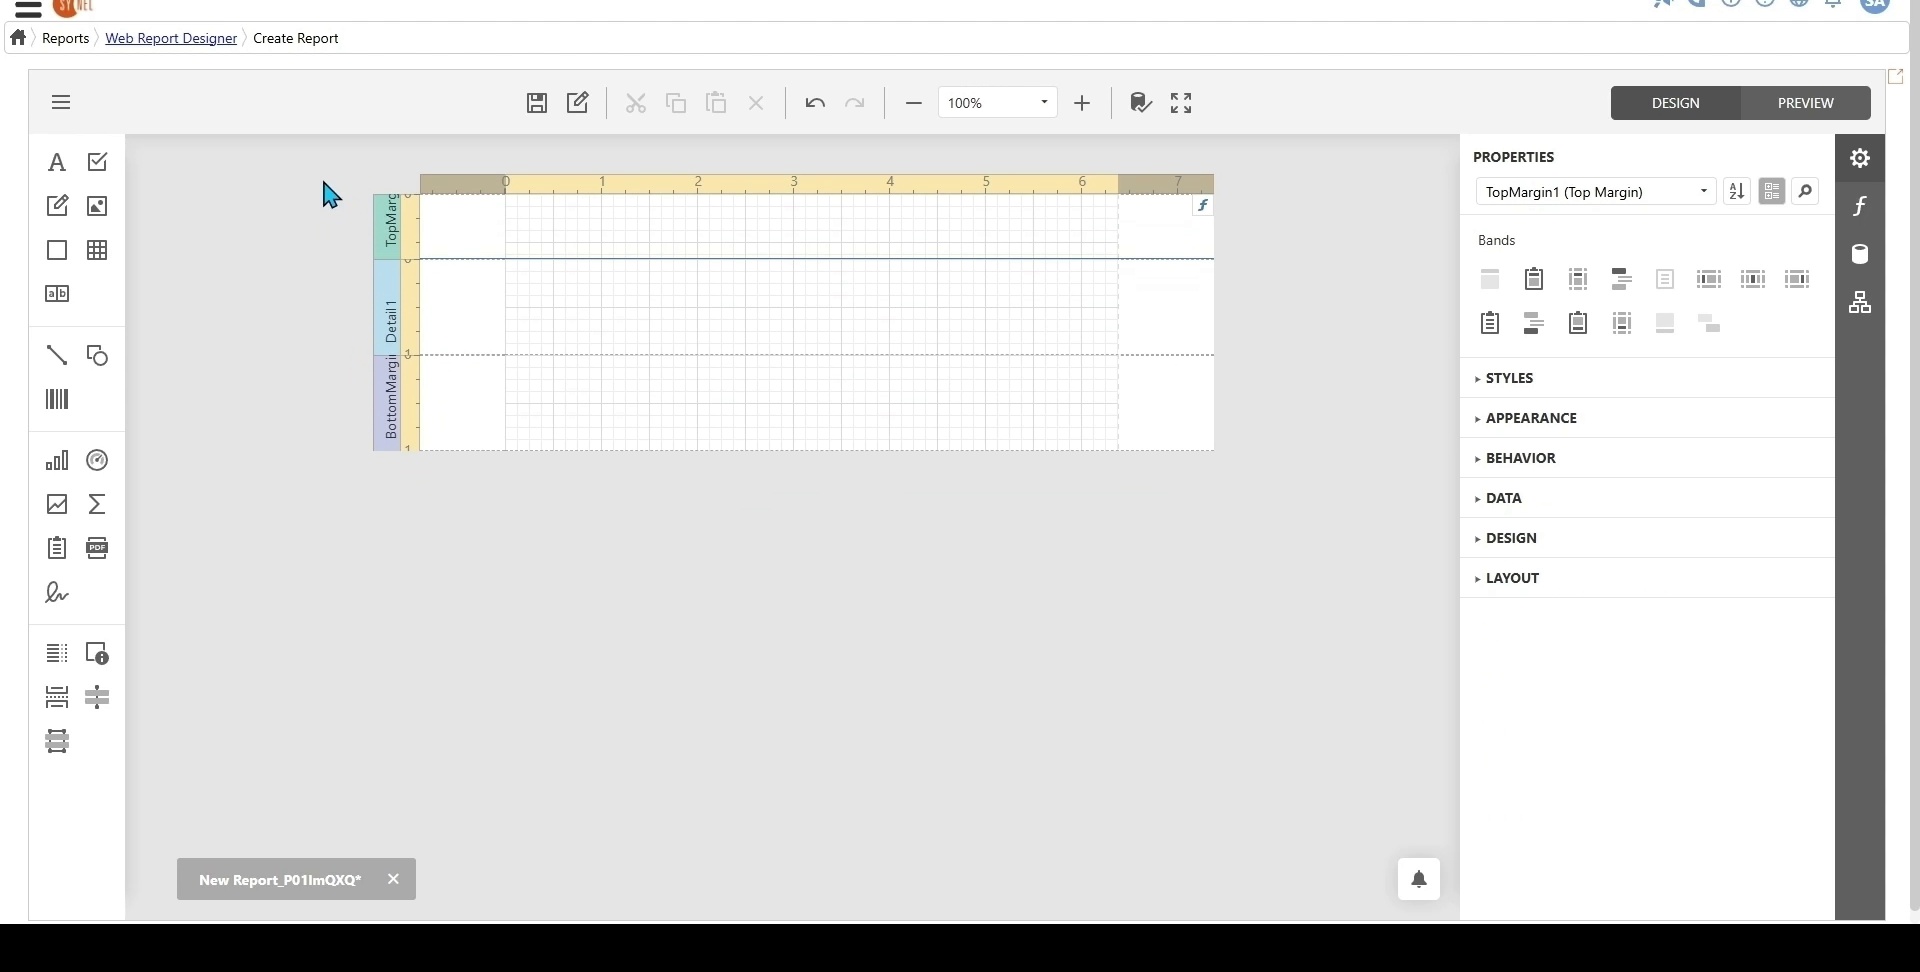
The Create Report page will open with a blank report in the designer.
User Interface Overview
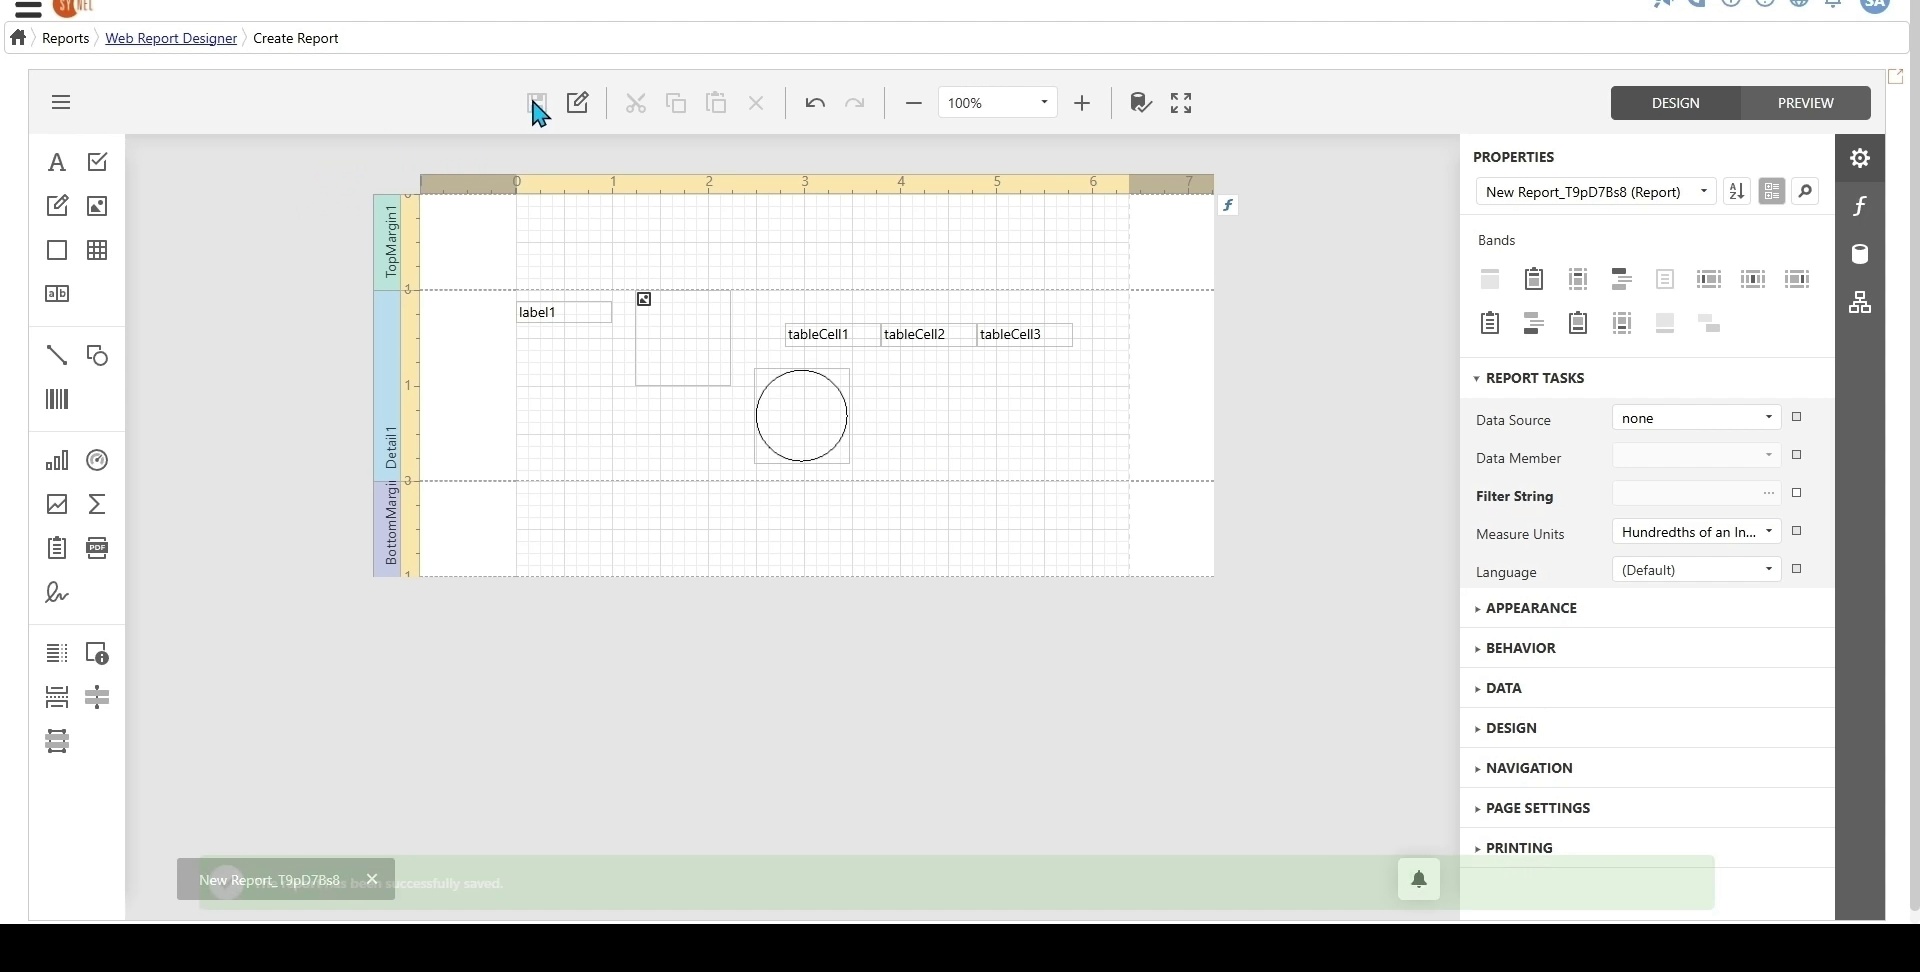
Design Surface
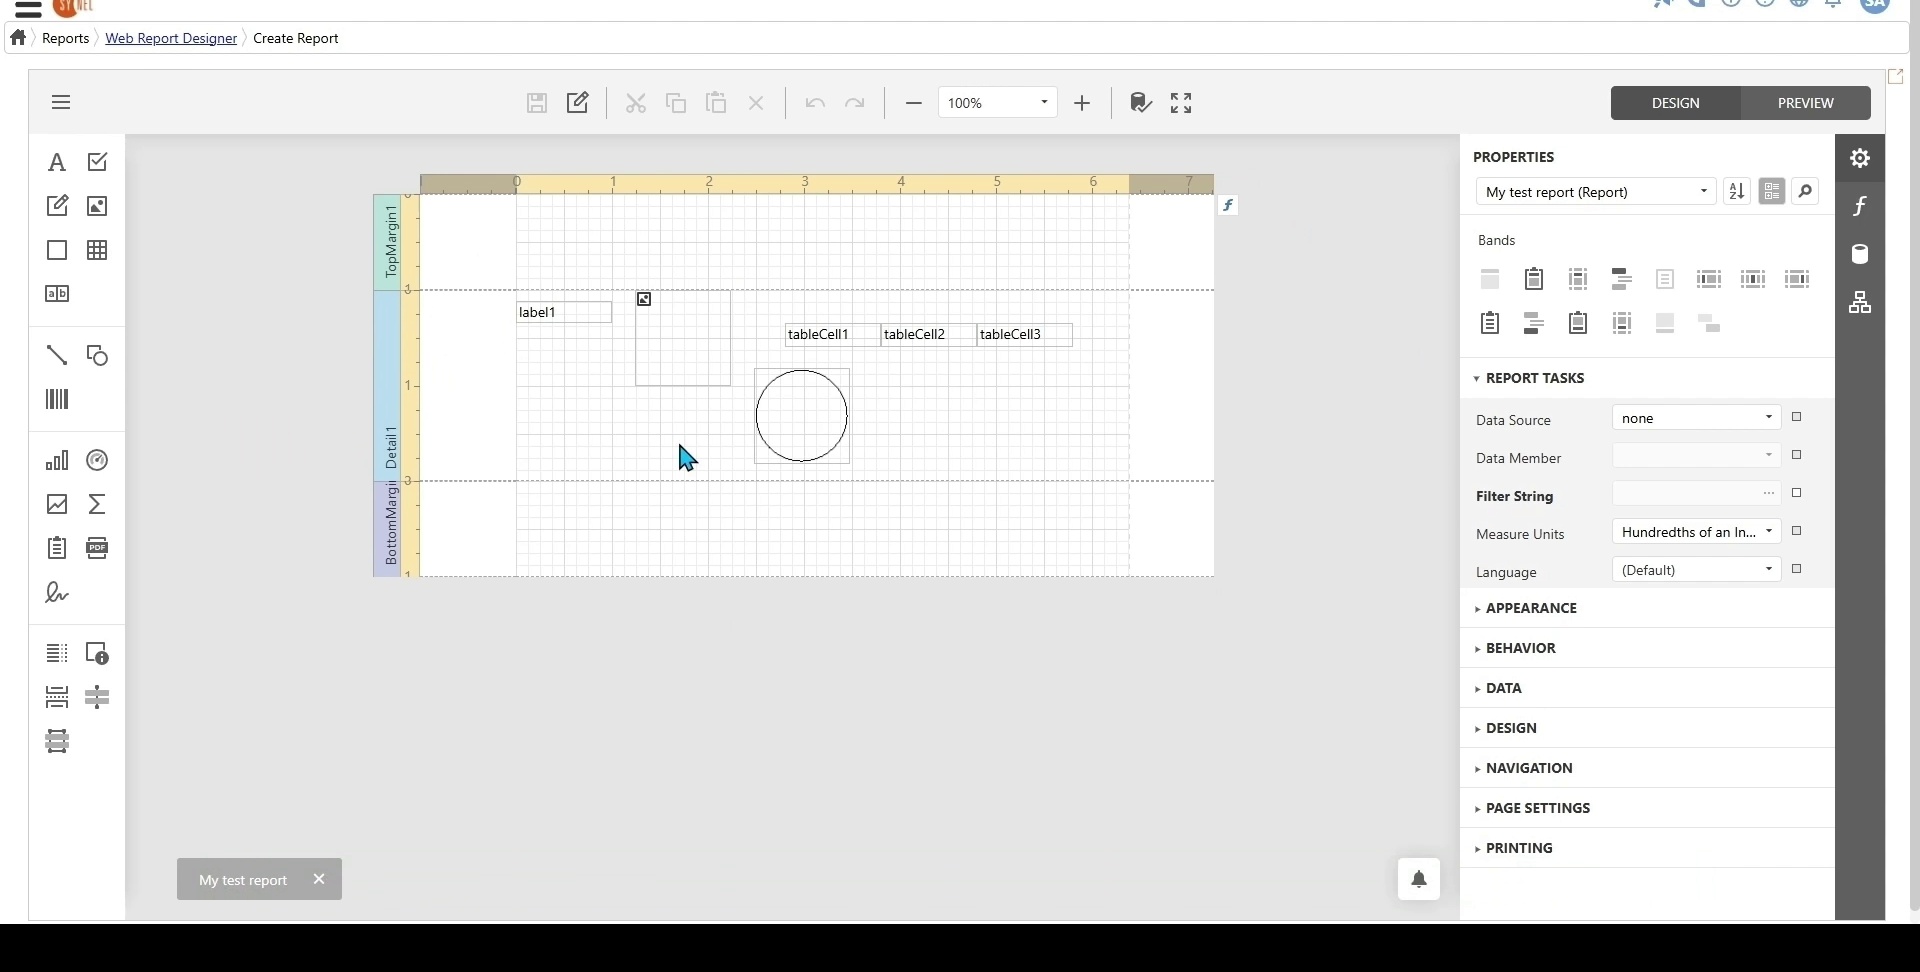
The design surface is where reports are built.
Each report consists of bands (sections of a report that hold components):
Top Margin, Bottom Margin, and Details Bands (always present and cannot be deleted).
Additional bands such as Report Header/Footer, Page Header/Footer, and Group Header/Footer can be added.
Rulers are available to adjust margin sizes by dragging the markers horizontally or vertically.
Toolbox (Left Panel)
Contains components such as:
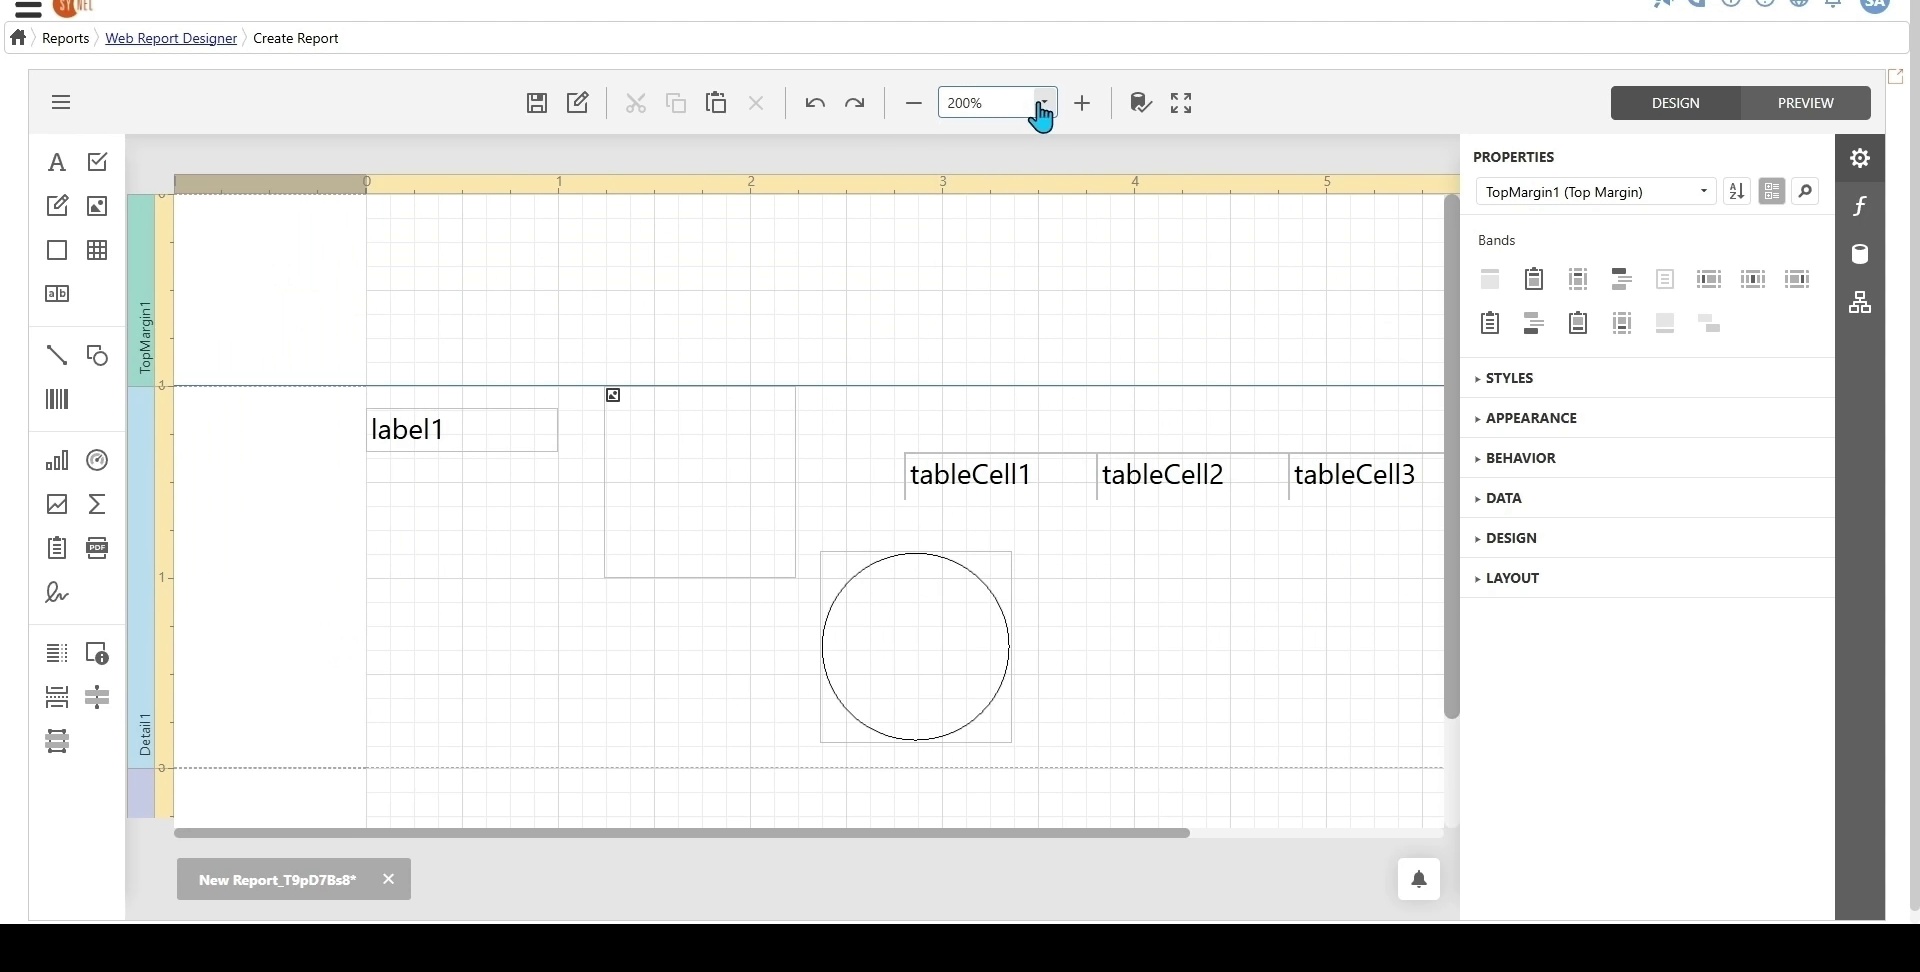
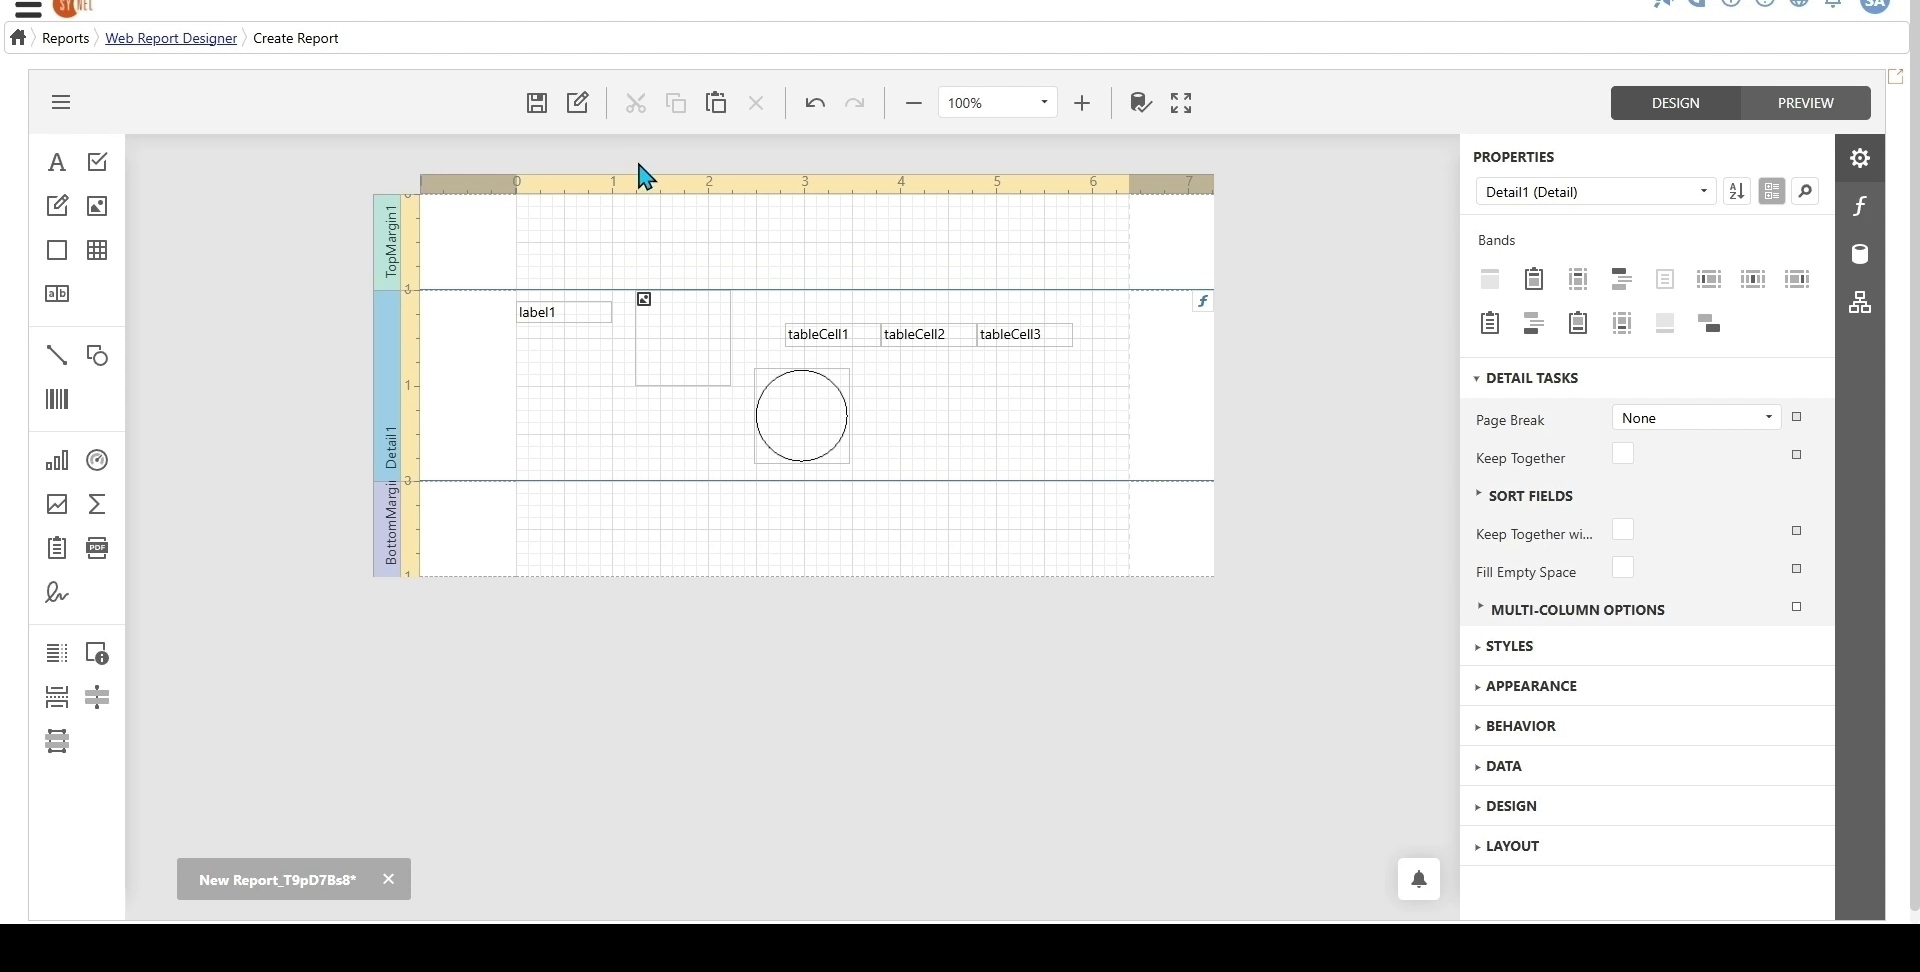
Labels, Pictures, Tables, Panels, Shapes, Lines, Charts, Gauges, Page Info, and Page Breaks.
To add a component:
Click on the component.
Drag and drop it onto the design surface.
Actions (Top Toolbar)
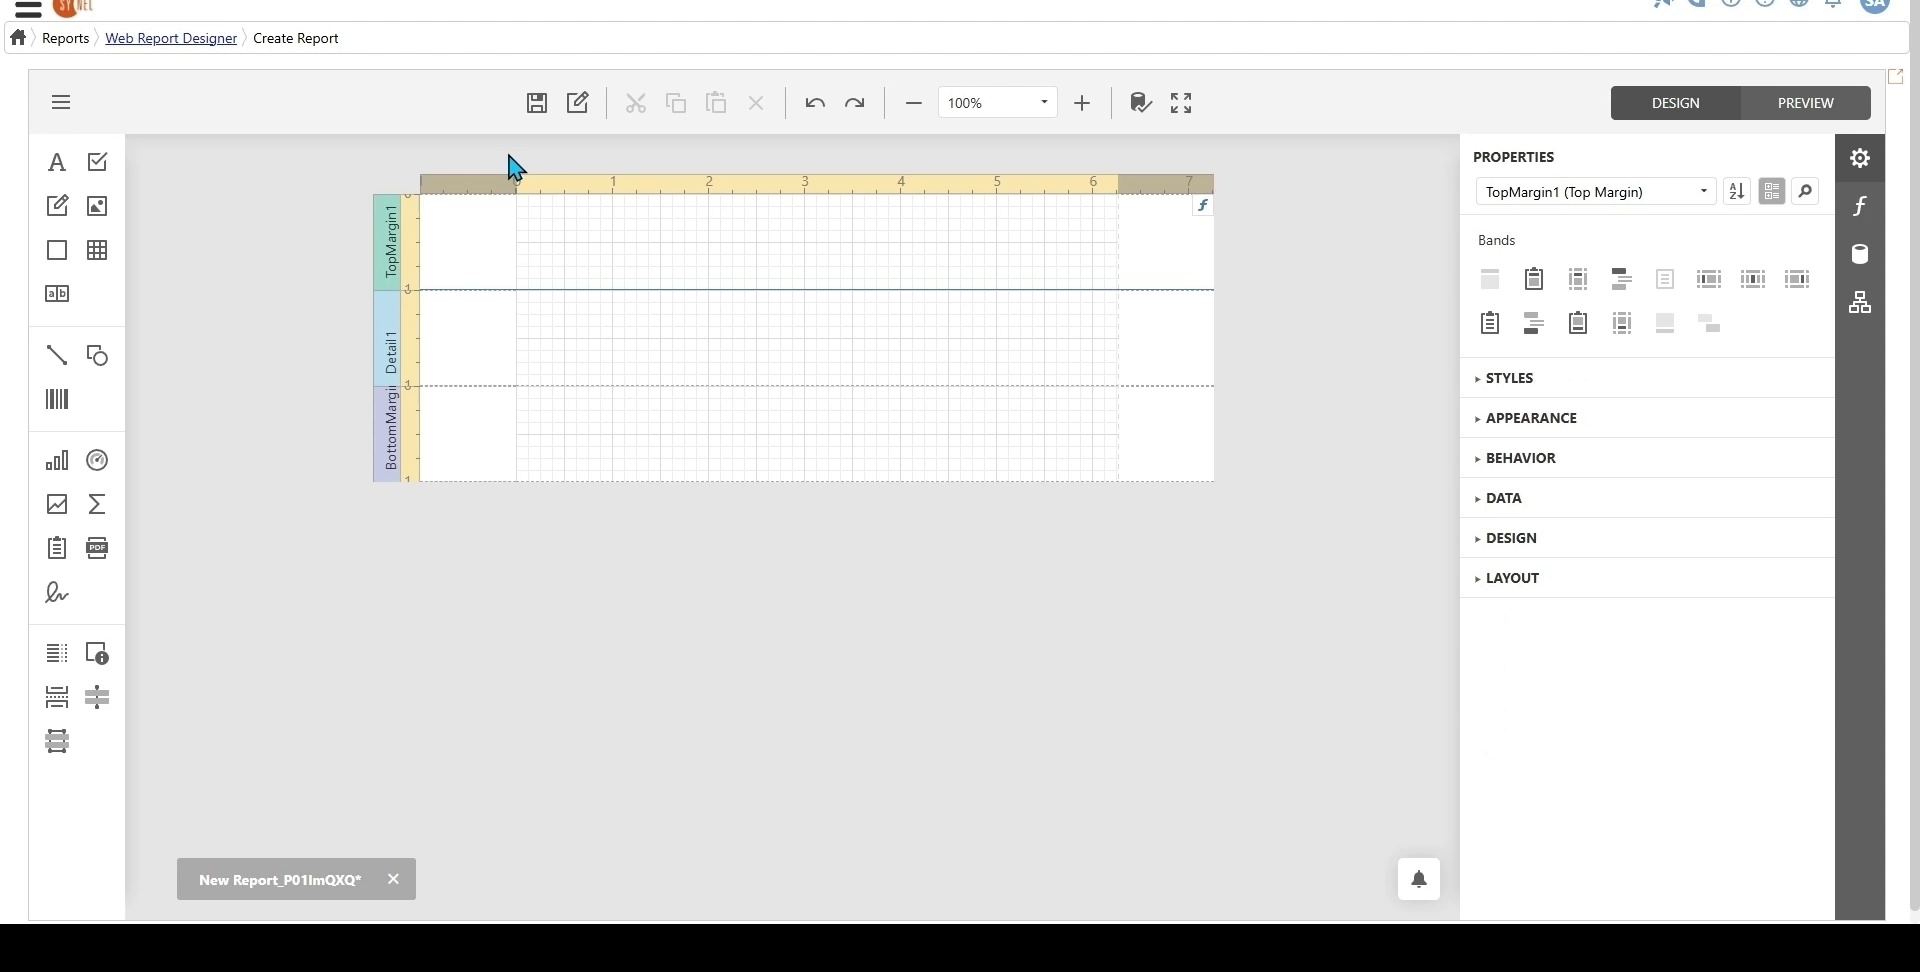
Zoom in/out: Use the plus (+) and minus (-) icons or select a predefined zoom level.
Copy, Cut, Paste, and Delete components:
CTRL+X (Cut), CTRL+C (Copy), CTRL+V (Paste), Delete (Remove component).
Undo/Redo with CTRL+Z and CTRL+Y.
Full-Screen Mode: Click the full-screen icon; press Escape to exit.
Validate Bindings Toggle: Highlights invalid data bindings when enabled.
Saving a Report
Click the Save icon.
The report will appear in the report list with a default name.
To rename:
Click Edit Report Details.
Enter a new name and save.
Previewing and Exporting Reports
Click the Preview button to view the report.
Available options:
Print the report.
Export to various file types.
Adjust zoom settings using the zoom controls.
Use Toggle Multi-Page Mode to switch between single-page and continuous scrolling.
Use the Search function to find specific text in the report.
Properties and Configuration Panels (Right Panel)
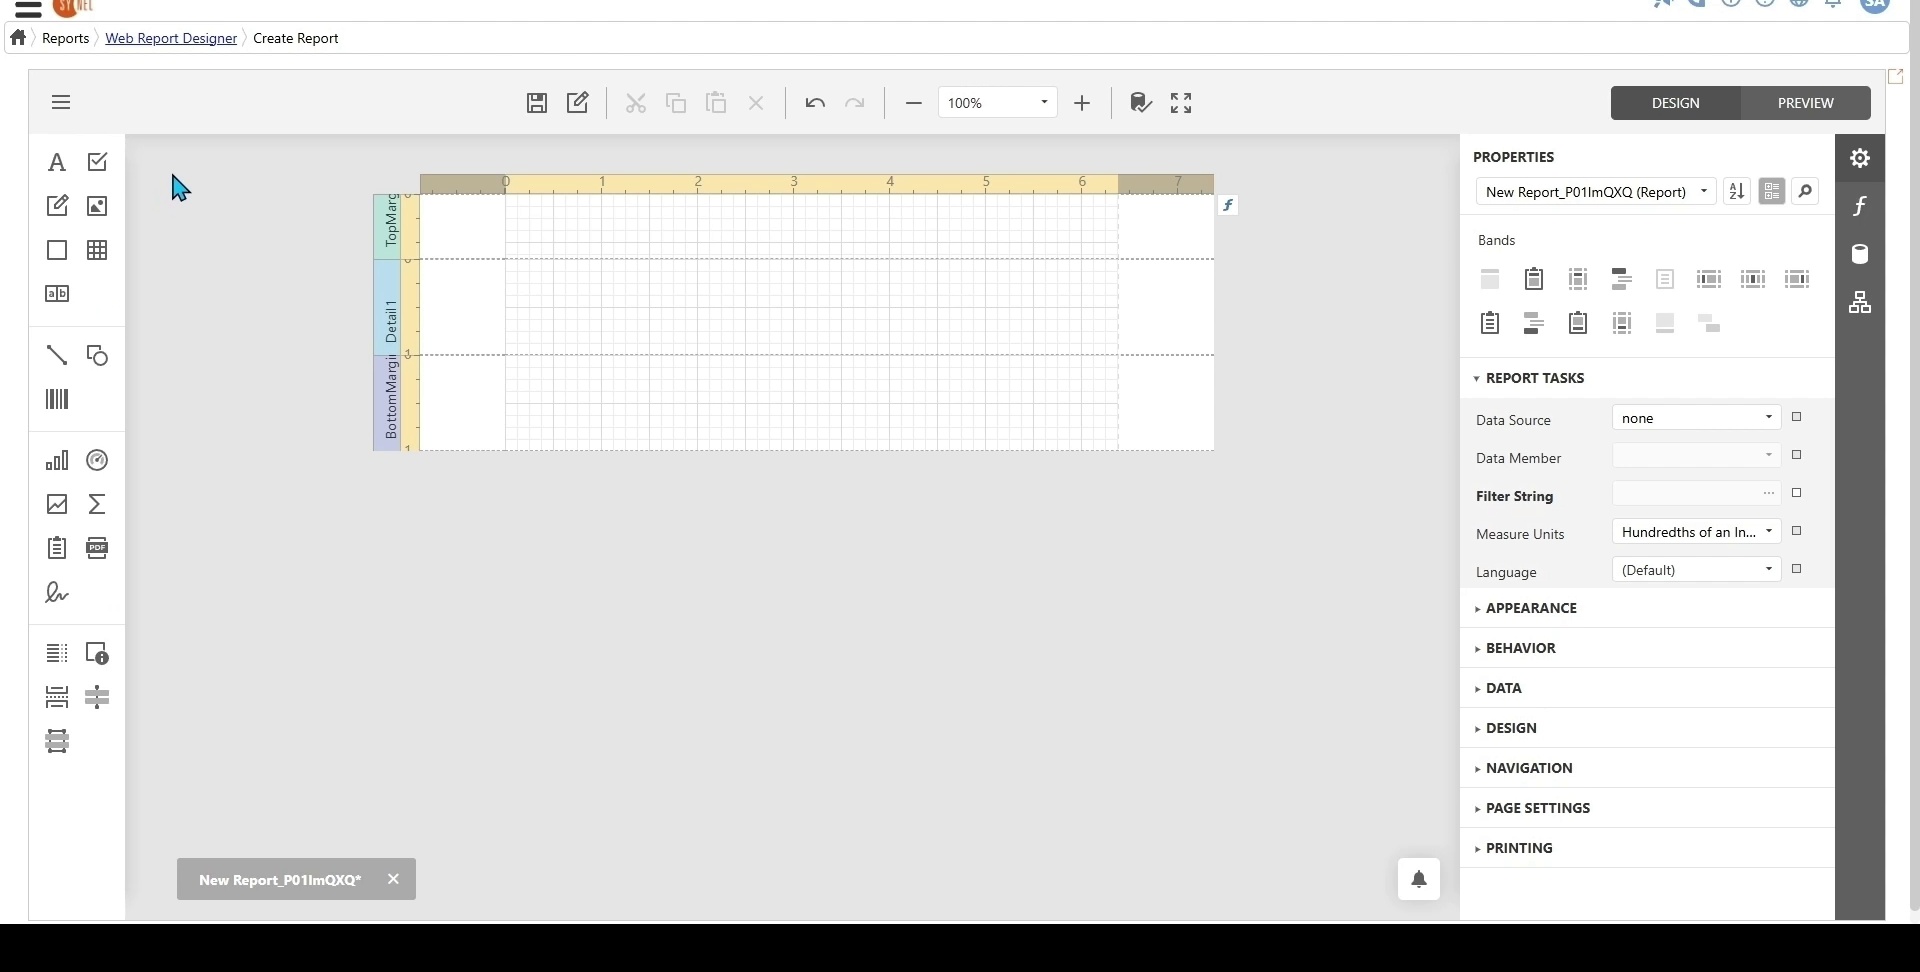
Properties Panel: Displays settings for the selected component.
Toggle between category view and alphabetical order.
Expressions Panel: Displays properties that can be bound to expressions.
Field List Panel: Displays data sources and parameters when added to the report.
Report Explorer Panel: Displays a hierarchical view of the report’s components.
Allows reordering of components via drag-and-drop.
Report Management Actions
View Report: Click the eye icon to open a preview.
Edit Report: Click the edit icon to modify the report.
Duplicate Report:
Click Duplicate Report.
A copy is created and added to the report list.
Delete Report:
Click the trash bin icon.
Confirm deletion.
Troubleshooting
Report not saving? Ensure there are no unsaved changes before exiting.
Invalid data bindings? Enable Validate Bindings Toggle to identify missing bindings.
Component placement issues? Use the grid and rulers for alignment.